Plan
Align cross-functional initiatives to strategic priorities
Traditional project management tools are about doing work right. Conductor is also about doing the right work, at the right time, with the right people.
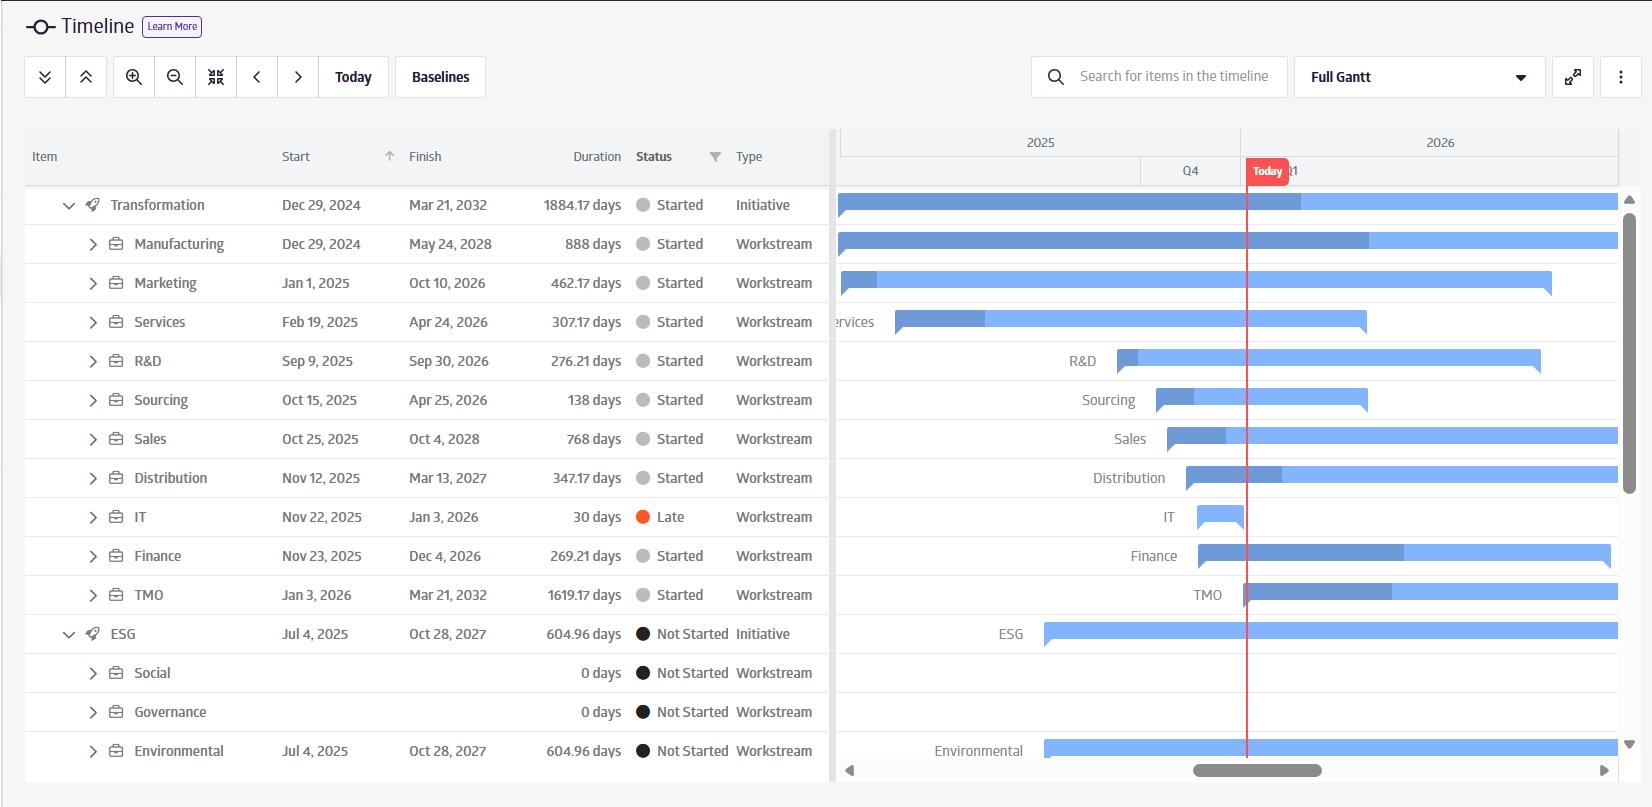

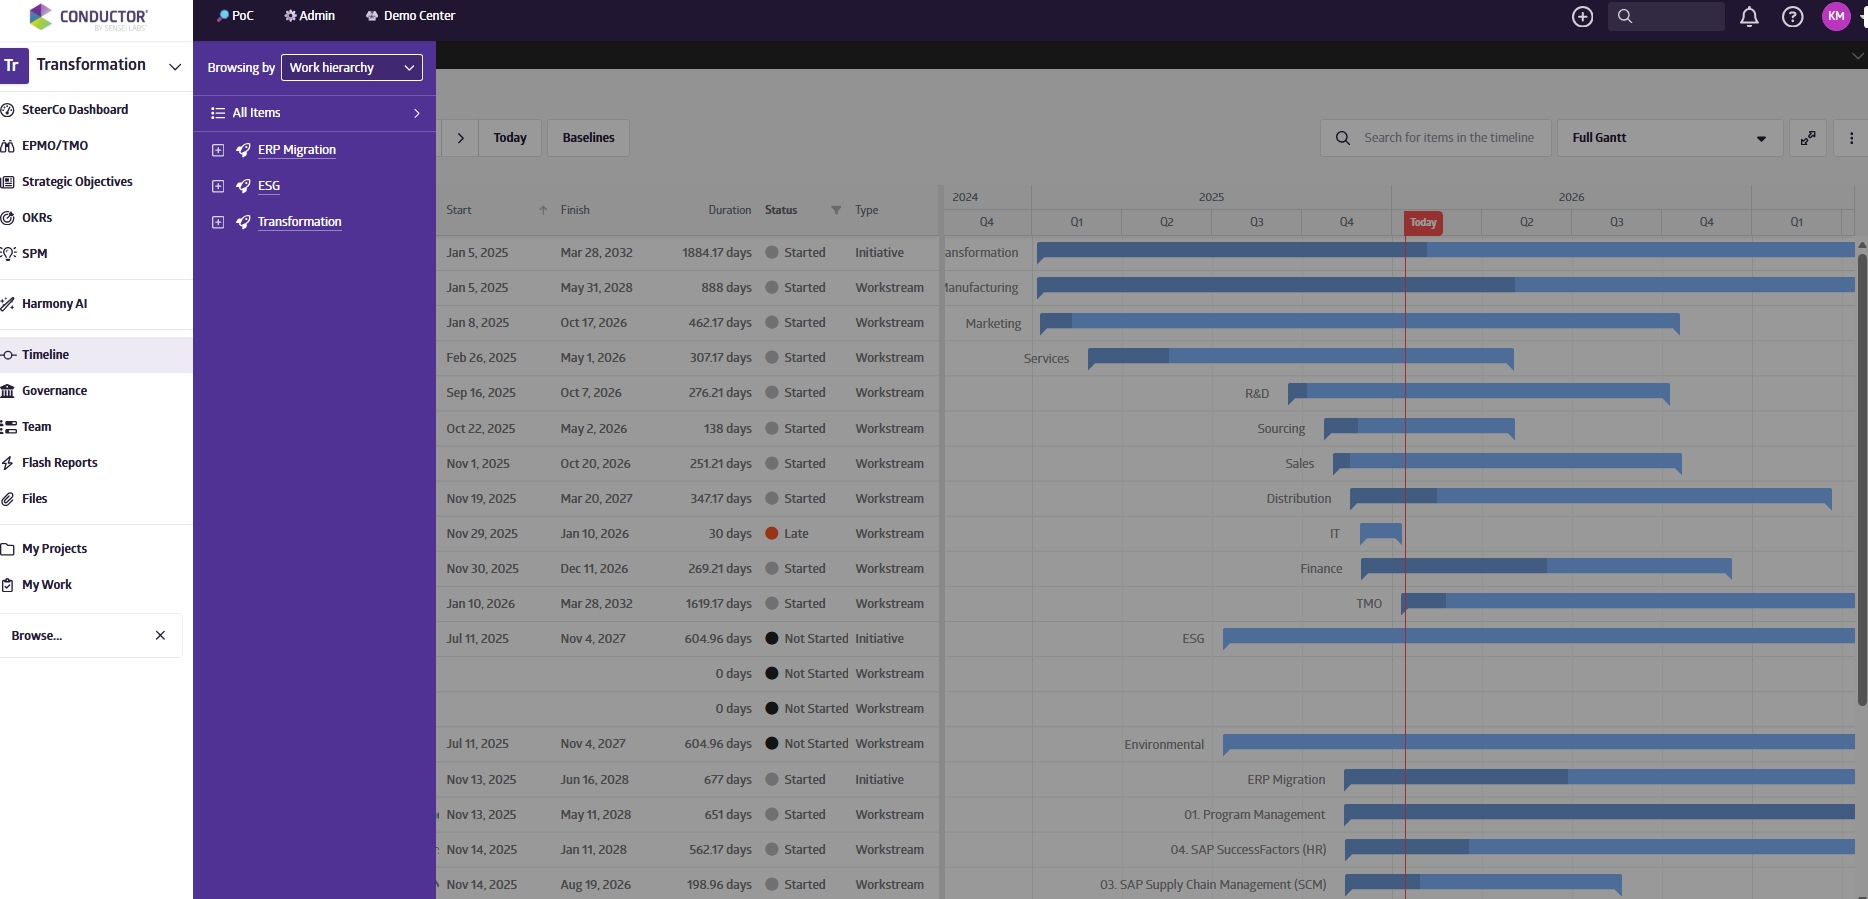

Strategic Portfolio Planning
Establish your roadmap of programs, workstreams, projects, and strategic objectives.
Clear line of sight from strategy to execution.
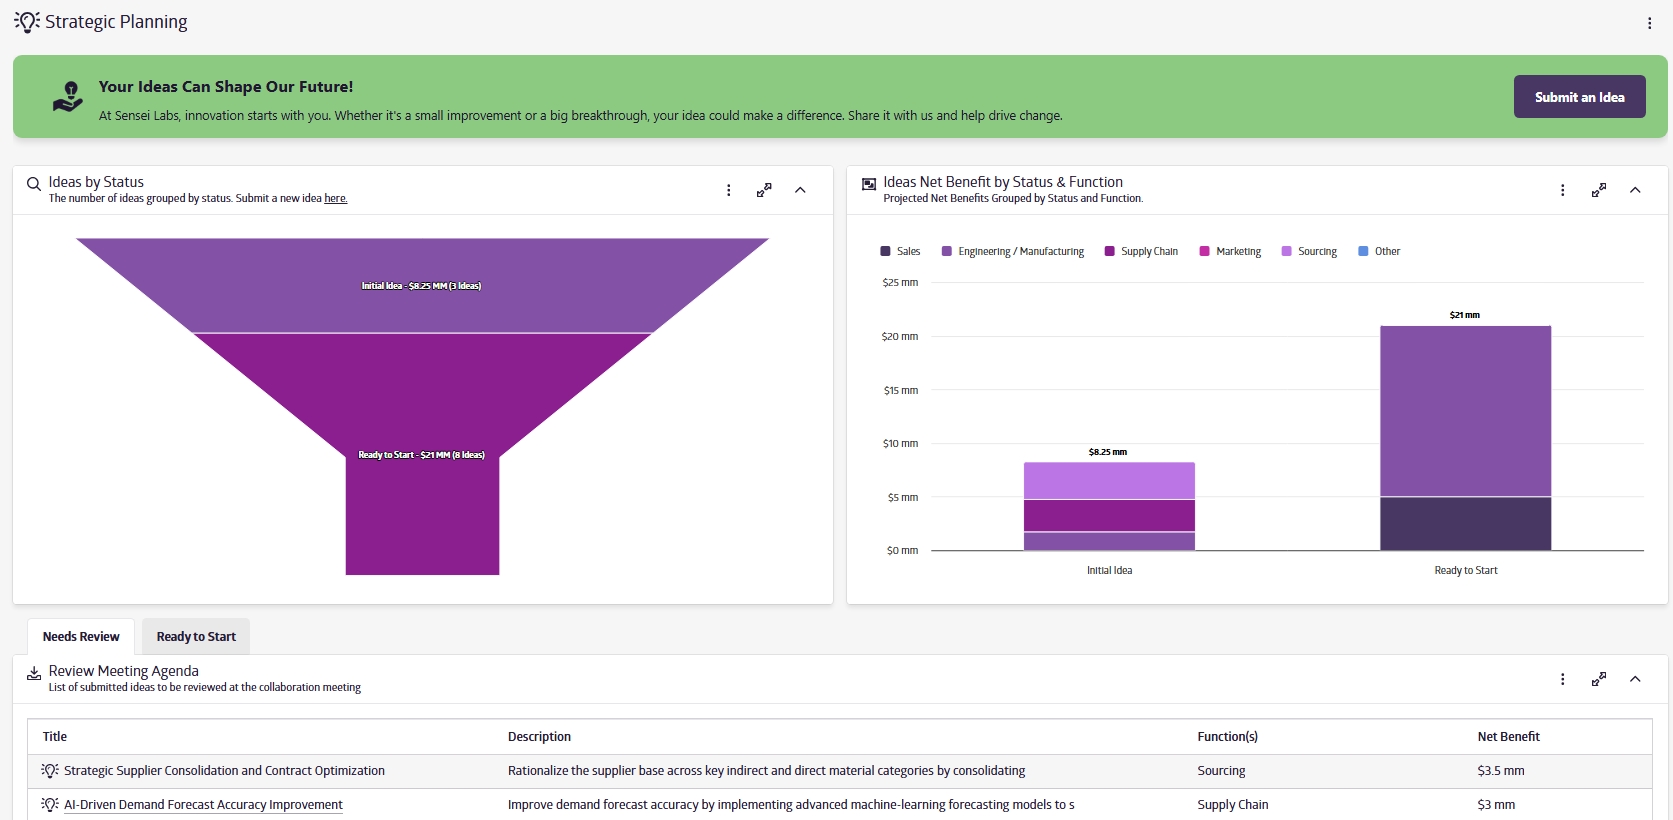
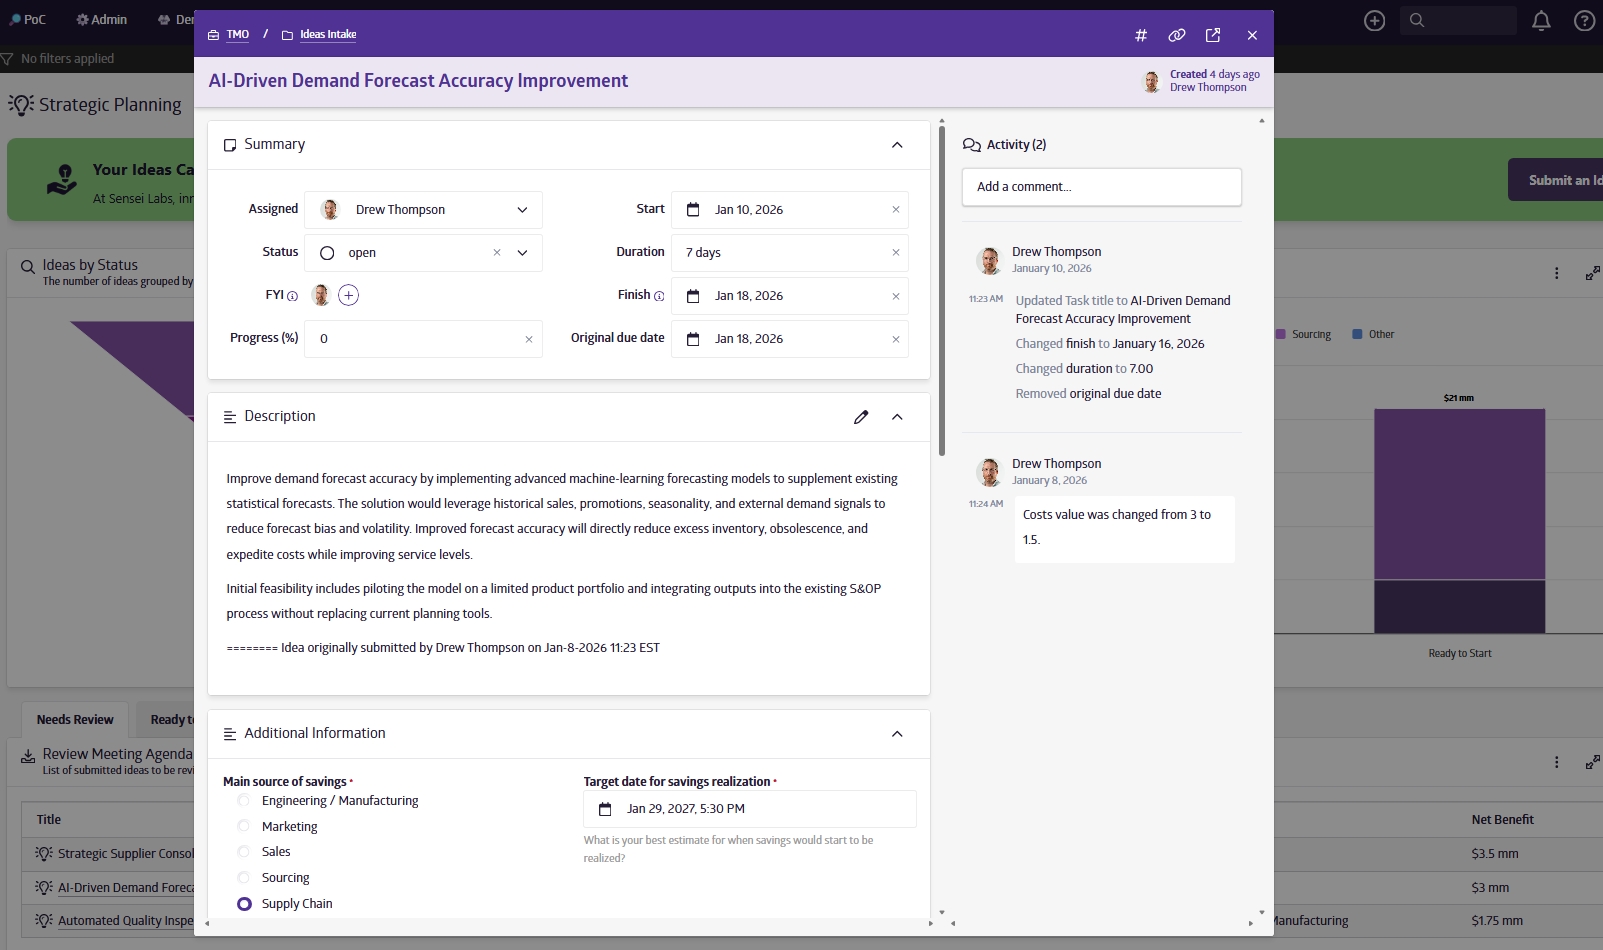
Idea Management
Capture and triage ideas with intake forms and scoring models to fuel innovation pipelines.
Only the highest impact ideas move forward.
Business Cases
Fast-track initiative approvals with integrated financials, approvals, and conditional guidance.
Faster, more confident investment decisions.

Dashboards
Design dashboards at every level of Conductor's hierarchy, manage permissions, embed rich widgets and Power BI, and present live without ever making another deck.

Enterprise-grade permissions
Enterprise-grade programs need enterprise-grade permissions. Manage your team's access through allow and deny permissions at the individual and group level, across Conductor Workspaces, Initiatives, Workstreams, and Projects.

Scenario planning
Master strategic portolio management with Conductor's scenario planner. Quickly build scenarios optimized for different KPIs, measure impact of project combinations, and share plans across your team.

Grids
Conductor's native grids deliver your customized reports right to your dashboards, complete with sorting, searching, filtering, and shareable bookmarks.
See why people love Conductor


